What’s a holiday weekend without me spending an inordinately long period of time with my nose buried in Tableau Server? I decided to find out if Server is running any better on Azure since the last time I checked.
The short answer: No. Not yet.
FYI – this is going to be a relatively short post and I’m going light on background information that you can pick up from other earlier entries. So, if this stuff makes no sense to you, use the reference material I point you to.
Back in September the gals and guys at Azure rolled out some fancy new instance types with nice SSD support. You can read about them here.
I thought I’d try to see if this new “D” series improved on the pretty lackluster performance the “A” instances provided Tableau Server. I documented my work with the A series here.
If you review the previous post, you’ll see that getting enough IO on an image was the key challenge. AWS EC2 makes provisioning the IOPS you need fast and easy. Azure does not.
I ran the exact same tests on Azure that I’ve run before against EC2 (details here and here ). If nothing else, this will be a very apples-to-apples comparison…kind of a shoot-out, actually.
I worked with Azure’s D4 (8 vCPUs, 28 GB RAM) and D14 (16 vCPUs, 112 GB RAM) using either 3 or 10 striped disks for the volume Tableau Server ran on. The OS was installed on a different volume. Both machines utilize Xeon e5-2660 cores @ 2.2 GHZ.
I mentioned that these new instances have nice SSD storage. They really do. The problem is that this storage is exposed as a temporary drive on the instances, making it unsuitable for a Tableau Server installation.
Unless you go “out of bounds” and hack up an unsupported solution which utilizes this storage, you’re still going to be on the hook for striping tons of disks in an attempt to provision enough IOPS to get Tableau (or any app) the IO it requires.
Let’s start with IOPS. Using Fio, I banged on the vaunted SSD of my D4. It is indeed quick:
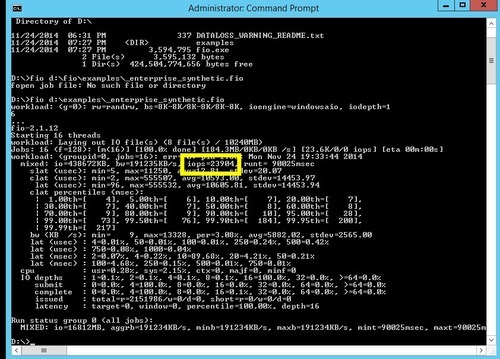
Nearly 24K IOPS against a mixed workload is nothing to sneeze at – it’s just about as fast as the SSD I have on one of my faster machines at home. Too damn bad we can’t use it! If we turn the VM off, poof! We’ll lose that storage if the VM is starts again and happens to come up on another host. Yes, I’m absolutely bitter.
Instead, let’s look at the Fio output from three striped 30 GB disks with Azure’s read/write caching turned on:

(IOPS = 1491) …and now the same test when caching is turned off

(IOPS = 1481) Don’t know what this caching is about? Read the article I wrote about “A” instances. It explains all.
Next, I striped ten 10 GB disks and ran a Fio workload against it:

We get 4130 IOPS from this arrangement with Azure read/write caching off (one can have a maximum of 4 disks with caching turned on per VM, so I didn’t bother since I’m dealing with a 10 disk striped set).
So you can already see where I’m going with this – a single EC2 general purpose SSD can burst to 3000 IOPS. Stripe two of these babies, and you’ve already got 50% more IOPS than with 10 striped Azure disks. Feh! This is too hard.
In the viz below, I compare an EC2 c3.2xlarge (8 vCPU, 15GB RAM) to the D4 (8 vCPU, 28 GB RAM). In all cases the AWS instance is faster “off the mark” against a complex workload. (Complex = a dashboard which hits a 200M+ row extract…read previous blog entries for more complete descriptions of simple vs. complex workloads)
Note how the max render time is always greater on the Azure VM, regardless of the disk being tested. Even the AWS machine running a single magnetic disk is faster than the Azure image running with 3 or 10 striped disks.

You may wonder at the lower average render time on the D4 – that’s because I’m picking up some of the cached renders that artificially drive down the number. I generally am able to filter these out, but a couple slipped through.
The combination of better CPU on the c3.2xlarge (e5-2680 @ 2.8 GHZ) and generally higher IOPS wins it for EC2.
When dealing with a simple workload, things are a bit more even:

Average render time is the same-ish across the board…but the delta between “max render time” is huge between the D4 and c3.2xlarge.
Lets observe the first 6 minutes of a 10-concurrent user rendering test using a combination of my two favorite perfmon counters:
- Blue counter: Processor – % Processor Time, _Total
- Black counter: Logical Disk – Average Disk sec / Transfer

The perfmon above shows the EC2 c3.2xlarge with a magnetic disk laboring away. You can see disk latency is often above 15ms, which isn’t great. Max latency during this six minute period was 95ms (bad) and average was 5 ms (good). Remember, this is a magnetic disk.
Now, the same test on the D4 using 3 striped disks:

Note the higher maximum latency (117 ms) and average latency (13 ms).
Yet again, the same test with 10 striped disks:

A max latency of 83 milliseconds and an average of 12 ms. These 10 striped disks are arguably on average slower than a single magnetic disk on EC2!
In both Azure tests, you can see the disk really struggle about a minute in, and during that time CPU utilization drops – it literally has nothing to do because the OS can’t get what it needs off of the disk fast enough. This doesn’t happen during the EC2 magnetic run, and it doesn’t happen with the test below…
Here’s EC2 running with two striped general purpose SSDs:

At an average latency of 1 ms and a max of 5 ms, we’re looking at a night and day difference.
Next, let’s compare the Azure D14 (16 vCPUs, 112 GB RAM) to the EC2 c3.4xlarge (16 vCPUs, 30 GB RAM). I’m going to be lazy and throw both the complex and simple workloads in the same viz:

The average and maximum render times are lower (sometimes significantly) on the c3.4xlarge.
- It’s easier to build IOPS up on EC2. Their approach is more flexible than Azure’s.
- Like instance types on EC2 tend to have better CPUs which run at a higher frequency
Want my data and live vizzes? Jump out here (http://russellchristopher.me/ec2/index.html ) and navigate to the VERY end of the story. I added some Azure stuff to the existing workbook I have on this page.
I’ve also added more Azure-related perfmon snapshots to the bottom of the page so you can compare on your own…With Azure’s “G” series on the horizon, I’m hoping that improved CPU will help Tableau go fast. Till next time…