As an ex-blue badge, I have a love for SQL Server that’s baked into my genes. I. Love. SQL. Server. Clear?
So, I was excited to load up SQL Server 2014 for the first time since it RTM’d and take it for a spin.
I thought it would fun to run a little test: namely, run the same dashboard against “on disk” SQL Server, a Tableau Extract, and In-Memory OLTP on SQL Server. Let’s see what comes back fastest, shall we?
(What?! You say you don’t know what In-Memory OLTP is? Luddite! Read about it here).
The Dashboard and Data
Anyway, here is the blue dashboard I came up with for my ex-blue badge testing. No, it doesn’t follow dataviz best practices, but it’s blue and I like blue today:
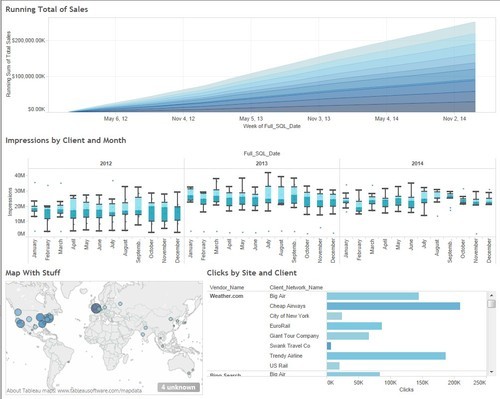
The key thing I wanted to do was introduce several levels of grouping into multiple vizzes to create a meat-and-potatoes dashboard representative of what a lot of people do with Tableau.
The dataset I used was pretty small – just under 4M rows in a star schema. Here’s the ERD:

Only basic indexing is in play with the on-disk database – I have clustered indexes created on each of the PK fields on the dimension tables.
Using SQL Server 2014
Upgrading my SQL Server 2012 to 2014 was like buttah – very straight forward and pain-free. This made me happy.
One must store in-memory tables in a new type of SQL Server filegroup used for this purpose, so I added one of these suckers to my database and then used the Table Memory Optimization Advisor to make in-memory copies of my original tables. The TMOA is pretty much like a wizard that tells you if you’re doing anything stupid, gives you some basic advice and then creates a copy of the table you’re working with (with or without data) inside the Memory Optimized Data filegroup.
I no longer consider myself a SQL Server Pro – more like a week-end warrior…and the fact that I could turn this part of the project around so quickly should be seen as a feather in Microsoft’s cap.
The Testing
I performed my testing as follows, timing each dashboard execution:
- Cycled SQL Server to clear cache (or for Tableau extract testing, I restarted the OS – this is the only way to know the extract file isn’t already in memory from a previous run). I called this an “un-cached run”.
- Ran the blue dashboard and closed Tableau
- Re-opened Tableau and ran the dashboard again (a “cached” run)
- Cycled SQL Server and/or restarted the OS once more and ran my blue dashboard, this time using Tableau Performance Recorder (another “un-cached run”)
…and things don’t look so good for In-Memory OTLP, do they?
Let’s look at the Performance Recorder output for Tableau extract based runs:

Geocoding took the most time, followed by the 920 millisecond query execution which helps to support this process.
Here’s the recorder when I ran the dashboard against “on disk” SQL Server:

The query which supports the running sum area chart at the top of my blue dashboard takes the longest here, followed by the same Geocoding task & geocode support queries.
And now, the surprisingly slow In-Memory OLTP source:

It took 29 seconds to run the query which powers the box and whisker plot viz. Insane! The others weren’t particularly light on their feet either, but 29 seconds is just ugly.
Here’s the SQL for the query in question:
SELECT
DATEPART(month,[DimDate].[Full_SQL_Date]) AS [mn:Full_SQL_Date:ok],
[DimClient].[Client_Name] AS [none:Client_Name:nk],
DATEPART(year,[DimDate].[Full_SQL_Date]) AS [yr:Full_SQL_Date:ok],
SUM(CAST(CAST([FactDailyResponse].[Impressions] as bigint) as BIGINT)) AS [sum:Impressions:ok]
FROM
[dbo].[FactDailyResponse] [FactDailyResponse]
INNER JOIN [dbo].[DimClient] [DimClient] ON ([FactDailyResponse].[Client_Key] = [DimClient].[Client_Key])
INNER JOIN [dbo].[DimDate] [DimDate] ON ([FactDailyResponse].[Date_Key] = [DimDate].[Date_Key])
GROUP BY
DATEPART(month,[DimDate].[Full_SQL_Date]),
[DimClient].[Client_Name],
DATEPART(year,[DimDate].[Full_SQL_Date])
I ran this sucker in Query Analyzer and got more or less the same result, then turned checked out the execution plan and saw several alerts that statistics on my table indexes were out of date.
…and that was the problem.
This help topic says that statistics are created automatically but not updated automatically on memory-optimized tables. When I updated the statistics manually on the dimDate table, query execution immediately dropped to ~3 seconds in Query Analyzer.
I updated statistics on all of my tables and then tried again:
That’s better – still slower than on-disk SQL. Surprised.

- Don’t forget to update your statistics!
- Since everything is “cached” in an in-memory OLTP scenario, you’ll get about the same perf each time you run a query
- Using In-Memory OLTP isn’t “fire and forget” like I’ve gotten used to with SQL Server over the years – looks like I’m going to need to spend some time adding & tuning indexes for best effect. This will make free-form analysis clumsy as each user may focus on different fields (which may or may not be indexed)
- Extracts still offering better performance since all tables are “pre-joined” inside it.
More to come!
(Edit #1: It’s about 2 hours later)
I’ve started adding NONCLUSTERED indexes in an attempt to improvement execution time:
- Index on the Date column in my Dimension Table: No Change
- Index on the Client_Key field in the Fact table used to join to Clients dimension – gained ~4 seconds: Average run time now at ~12.5 seconds from ~17: Equal to disk storage, at least
- Index on the Date_Key field in the Fact table which joins to the Date dimension: No Change
(Edit #2)
If Tableau gets great performance by creating a single in-memory table as the result of joining other tables, why can’t SQL Server? Let’s try it!
I took the same query that represents joining my fact table to all dimensions and just made a single materialized version of said query as a table on disk. Good so far. However, when I attempt to turn this into an In-Memory OLTP table, no joy:

Damn.
(Edit #3)
6:30 AM here, and I just added NONCLUSTERED indexes to each and every column on the Fact table that I join with. That got me slightly more than 1 second of additional improvement, so I’m no averaging about 11.1 seconds on this dashboard compared to 10.6 seconds against it’s on-disk cousin. Based on the fact my stopwatch thumb can be fast or slow depending on how much caffeine is coursing through my veins, I’ll call this “even”.
If I really wanted to go all out, I see an opportunity to create a multi-column covering index on three fields in my fact table (two of which are measures). I suspect that would improve perf on the visualization that is taking “longest” at about 3.5 seconds. However, that seems to be overkill to me, so I’ll leave well enough alone for now.