
Before you do anything else, you need to know what the current state of your Tableau – Redshift relationship is vis-à-vis performance.
You also need to be able to track whether changes that you make are having a positive impact.
We’ll use this post to talk about how to measure this stuff.
I generally like to watch two things:
- Performance of my queries inside Redshift
- The “perceived performance” my users will experience when they execute a Redshift-bound dashboard
It’s also very interesting to combine this information. Ultimately I focus more on perceived performance of Tableau, so I always review Redshift’s performance in that light. We’ll talk more about that later.
Measuring Redshift Performance.
As far as I know, there are three ways to see the query text getting fired by Redshift and see query execution time:
- You can turn off Tableau’s use of cursors and view the query text right in the AWS / Redshift Console
- You can query Redshift’s STV_ACTIVE_CURSORS virtual system table, but this sucker doesn’t store a “history” of queries as far as I know. You can also hit STL_QUERY and/or STL_QUERYTEXT for more historical text
- You can pull the queries from Tableau’s logs
I don’t like option two because a query with lots of text (which is most of them for Tableau) gets split up across multiple rows in these tables. I hate trying to read the query across multiple rows.
Option one is great for spot-checking things, not so hot if you want to create a historical baseline. I loooove option two. Below, we’ll discuss both.
Turn Cursors Off
By default, Tableau uses cursors when returning a resultset from Redshift. The side effect of using a cursor is that you can’t see the actual query that Tableau fires inside the Redshift console. Instead, you’ll get a message like:
FETCH 10000 in “SQL_CUR03ART31”
You’ll use a Tableau Data Customization (TDC) to turn cursors OFF.
Keep in mind that doing so will cause ALL rows to be delivered to Tableau in one “big dump truck of data”. If you do something silly which returns 3 billion rows, don’t be surprised if you use up all the RAM on your machine. That’s why we use cursors in the first place. You also generally won’t want to try an extract from Redshift with cursors turned off for the same reason.
You can read about leveraging a TDC here , but I’ll give you the quick and dirty:
Here is a basic customization which will turn cursors off (UseDelcareFetch=0):
<connection-customization class='redshift' version='9.0' enabled='true'>
  <vendor name='redshift' />
  <driver name='redshift' />
  <customizations>
    <customization name='odbc-connect-string-extras' value='UseDeclareFetch=0' />
  </customizations>
</connection-customization>
You can deploy a TDC using one of two approaches:
#1: The customization above can be dropped into a text file with a .TDC extension and deposited into your Documents\My Tableau Repository\Datasources (Desktop) or Program Files\Tableau\Tableau Server\<version>\bin (Server) folder.
#2: The customization can also be added directly to the XML of your data source. If you open your workbook and/or data source with a text editor, you might see something like this:
<named-connections>
  <named-connection caption=’foo.foo.ap-southeast-1.redshift.amazonaws.com' name='redshift.1foo'>
    <connection class='redshift' dbname='tpchdslitev1' odbc-connect-string-extras='' one-time-sql='' port='5439' schema='public'
     server=foo.foo.ap-southeast-1.redshift.amazonaws.com' single-node='no' sslmode='' username='foo' /
   </named-connection>
 </named-connections>
Change it to this:
<named-connections>
  <named-connection caption='foo.foo.ap-southeast-1.redshift.amazonaws.com' name='redshift.lfoo'>
   <connection class='redshift' dbname='tpchdslitev1' odbc-connect-string-extras='UseDeclareFetch=0' one-time-sql='' port='5439'
   schema='public' server='foo.foo.ap-southeast-1.redshift.amazonaws.com' single-node='no' sslmode='' username='root'>
      <connection-customization class='redshift' enabled='false' version='10.1'>
        <vendor name='redshift' />
        <driver name='redshift' />
         <customizations>
            <customization name='odbc-connect-string-extras' value='UseDeclareFetch=0' />
         </customizations>
      </connection-customization>
    </connection>
  </named-connection>
</named-connections>
I’ve also found I can simplify the named connection and simply use the odbc-connect-string by itself – but I don’t know if this is “officially supported”:
<named-connections>
  <named-connection caption=’foo.foo.ap-southeast-1.redshift.amazonaws.com' name='redshift.1foo'>
    <connection class='redshift' dbname='tpchdslitev1' odbc-connect-string-extras='UseDeclareFetch=0' one-time-sql='' port='5439'
     schema='public' server=foo.foo.ap-southeast-1.redshift.amazonaws.com' single-node='no' sslmode='' username='foo' /
   </named-connection>
 </named-connections>
I prefer the “inline data source” technique by far. Using a .TDC file is too global for my taste. In fact, if you deploy a TDC for a vendor/driver to your Tableau Server, then ALL of the workbooks you deploy which use the same vendor/driver MUST use that TDC. If someone tries to publish or execute a “non-TDC-ed” workbook, you can expect to see an error message like this:
Keychain authentication does not work because either the required TDC file is missing from Tableau Desktop, or the TDC file on Tableau Desktop differs from the TDC file on Tableau Server
I’ve also see this break extract refreshes that used to work.
Anyway, after you use approach #1 or #2, you’ll be able to see queries in the AWS console. Good.
Use LogShark
Logshark is the bee’s knees when it comes to collecting Redshift data. It’ll parse your Tableau Server (or Desktop) logs into handy tables in a PostgreSQL database, and then you can point Tableau at Postgres.
This is the way I do most of my work:
- Run tabadmin cleanup –restart to clear my logs (that’s a double dash in front of restart, but wordpress keeps turning it into a single. grrr)
- Execute Redshift-connected vizzes (at least twice each!) on Tableau Server using the :refresh parameter (quite often I’ll use TabJolt to do this in an automated fashion)
- Grab my logs with tabadmin ziplogs <somename.zip>
- Use Logshark’s VizqlServerPerformance plugin to parse ONLY queries
- Report!
Let’s talk about each step:
Step 1: The smaller your logs are, the faster Logshark will churn through them. I therefore always get rid of “old stuff” before I start testing. You may not have the ability to restart your server (pesky users!) in order to delete old logs – but if you can, do it.
Step 2: Both Tableau Desktop and Tableau Server WANT to cache on your behalf – and this is good. However, when I test Redshift, I don’t want Tableau’s cache preventing queries from getting executed against the database. So, I always append ?:refresh=yes to the URL of the viz I’m going to render. If I use TabJolt, I use this parameter on each and every viz in my vizpool.csv file, as well. You want to run each viz twice to make sure each QUERY gets fired at least twice – the first execution can be relatively slower due to query plan generation.
Step 3 is pretty self-explanatory. After the you’ve generated some logs, you need to grab them
Step 4 is the fun bit. You will use a subset of Logshark’s functionality to parse your logs. In the case of parsing query executions, most of the default work that Logshark will do for us is wasted. Therefore, we tell it to only use two “plugins”. The VizqlServer plugin normally gets run, but VizqlServerPerformance is special – it generates additional tables in Postgres that most mere mortals don’t care about.
But you’re not a mere mortal, are you?

Here’s what happens as a result:

…and here we see the “special” plugin running:

If we pop over to PostgreSQL with a tool like PgAdmin, we can see all the lovely tables that got created for us:

The tables we really care about are:
- vizql_construct_protocol: Tracks connections being made to a database
- vizql_qp_query_end: Tracks what Tableau’s query processor is doing with a query
- vizql_end_query: Tracks the actual execution of a query
You’ll want to create a data source using these three tables:

Once you do so, you can build a dashboard very, very quickly. Here’s one that tracked all query activity on my server over a few hour period:

I can see:
- Overall, dashboard DD1 is the “most expensive” in the database, and it fires 6 queries when rendered.
- The VizQL Error Dashboard is relatively cheap to execute, but it must be getting run all the time based on query count
- Queries from Redshift have the largest variation in execution time

The Flight Delays Dashboard looks like it’s been executed twice – I can see that in the boxplot.
The vizzes I normally use aren’t this high level, though. I tend to look RIGHT at the queries being executed. Below I can see the databases which were leveraged, which dashboard executed which worksheets, and which worksheets executed which queries:

This sort of looks like what you can get out of the Performance Recorder – except it’s a bit more simple and covers a longer time period.
Once you have started collecting this info, you can get pretty fancy. During hardcore testing periods I might run 30 different “tests” (which means 30 different logs and 30 different Logshark runs). I’ll then do some basic ETL and drop ALL my results into a single database (adding a new column to the database so I can “label” each test).
Do that, and you can create bump charts which show the average query time improvement (or abject failure) of each of your tuning efforts (The “label” I added is on the x-axis):

In the viz above, I have 5 fairly similar copies of the same database running in Redshift. I’m making small changes to each database and then seeing how things go. Look at the 3rd query. You can very clearly see that whatever I’ve done in database design #3 (light blue) is GREAT for the query in question. I can also see that database design #2 is a dog – results always seem to be pretty bad for queries #1 and #2.
By the way, this whole approach is NOT perfect – far from it, actually. The Protocol ID that Tableau generates when it creates a connection to a database is not unique. The IDs get re-used after a while – this means that if you run a log over 2-3 days of data, you’re going to get duplicate protocol IDs showing up, and your JOINS will get messed up. I use this technique to grab an hour or two of logs only – going this route is fairly safe and generally error-free.
If you want the first, more basic workbook, feel free to download it from here.
Measuring Perceived Performance
As I mentioned earlier, I want Redshift to be fast so that Tableau is fast. That’s why focusing on Redshift alone is not good enough. To monitor the perceived performance my users can expect, I steal the “Stats for Load Times” viz right from Tableau Server. You can grab the viz using this technique.

Each one of those little circles in the What Are the Exact Load times for Views worksheet includes the render time of the viz, as well as the Vizql Session ID. 
This is really important because that VizQL Session ID is ALSO associated with the executions of queries in the database that Logshark builds for us. You now have a really easy way to tie back query execution of the 5-6 queries that might get fired for a Dashboard to the actual “experience” your user gets: Is the dashboard fast? Is it slow? etc. 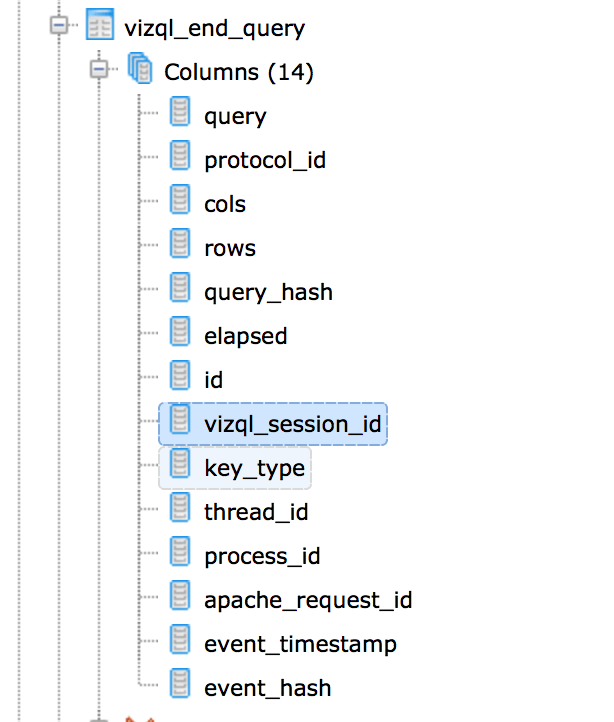
Tying query performance (as measured by Logshark) back to “user experience” (as captured by “What are Exact Load times for Views”) is the holy grail. I typically View Data on the workheet above and then export to CSV. After doing so, I can join it directly back against my original PostgreSQL data source using a Cross Database Join (hooray!). I can also use the Union feature to pile one CSV on top of another when I’m doing multiple test runs.
Here’s a simple sample of what you might create with all this yummy information:
The Dashboard, Test Name, and Database Name information comes from Logshark. I marry it with Dashboard execution time which comes from the CSV file I exported.

And that’s it. Now you know how to measure success…or lack of it. In the next entry, we’ll actually start getting into what you should do.
Cheers and happy new year!